As an Affinity Complete Care Administrator, one of my responsibilities is to see trends and do forecasting through reports that I pull from the client’s repository. Without the use of partner tools or even third-party vendors, such as the Hive from Verqu, who can provide detailed activities throughout the repositories (even down to a document), pulling reports is a feat that can be time-consuming and somewhat daunting. But the results can be powerful once you aggregate the data and then realize how you can better manage the system or enhance the organization’s workflow. With some finagling, you can identify your NetDocuments power-users, what kind of files are being placed into your cabinets, and who works from where remotely during the pandemic.
What about the document management administrators who don’t know that they can pull this helpful information or don’t have the time to do so? NetDocuments came out with an easy solution called “Analytics,” which is part of their Learn pillar. The new tool allows the everyday ND administrator to quickly take a glance at its’ dashboard and visibly detect any red flags. As we take a look at the product, keep in mind that this is just the beginning of a model that will evolve into a better citizen just like all other NetDocuments products.
NetDocuments Analytics is captured at two levels: The Repository and Cabinet levels (soon to be 3 with Workspaces. I can’t wait to see this!).
Here are some brief highlights of the Repository level. It allows you to see:
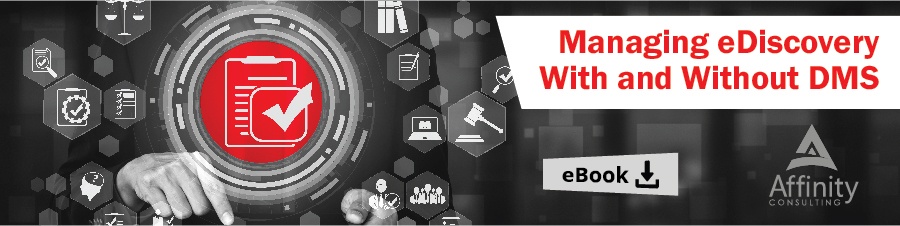
- How many users are logged in on a daily basis
- Bandwidth between the service and the users
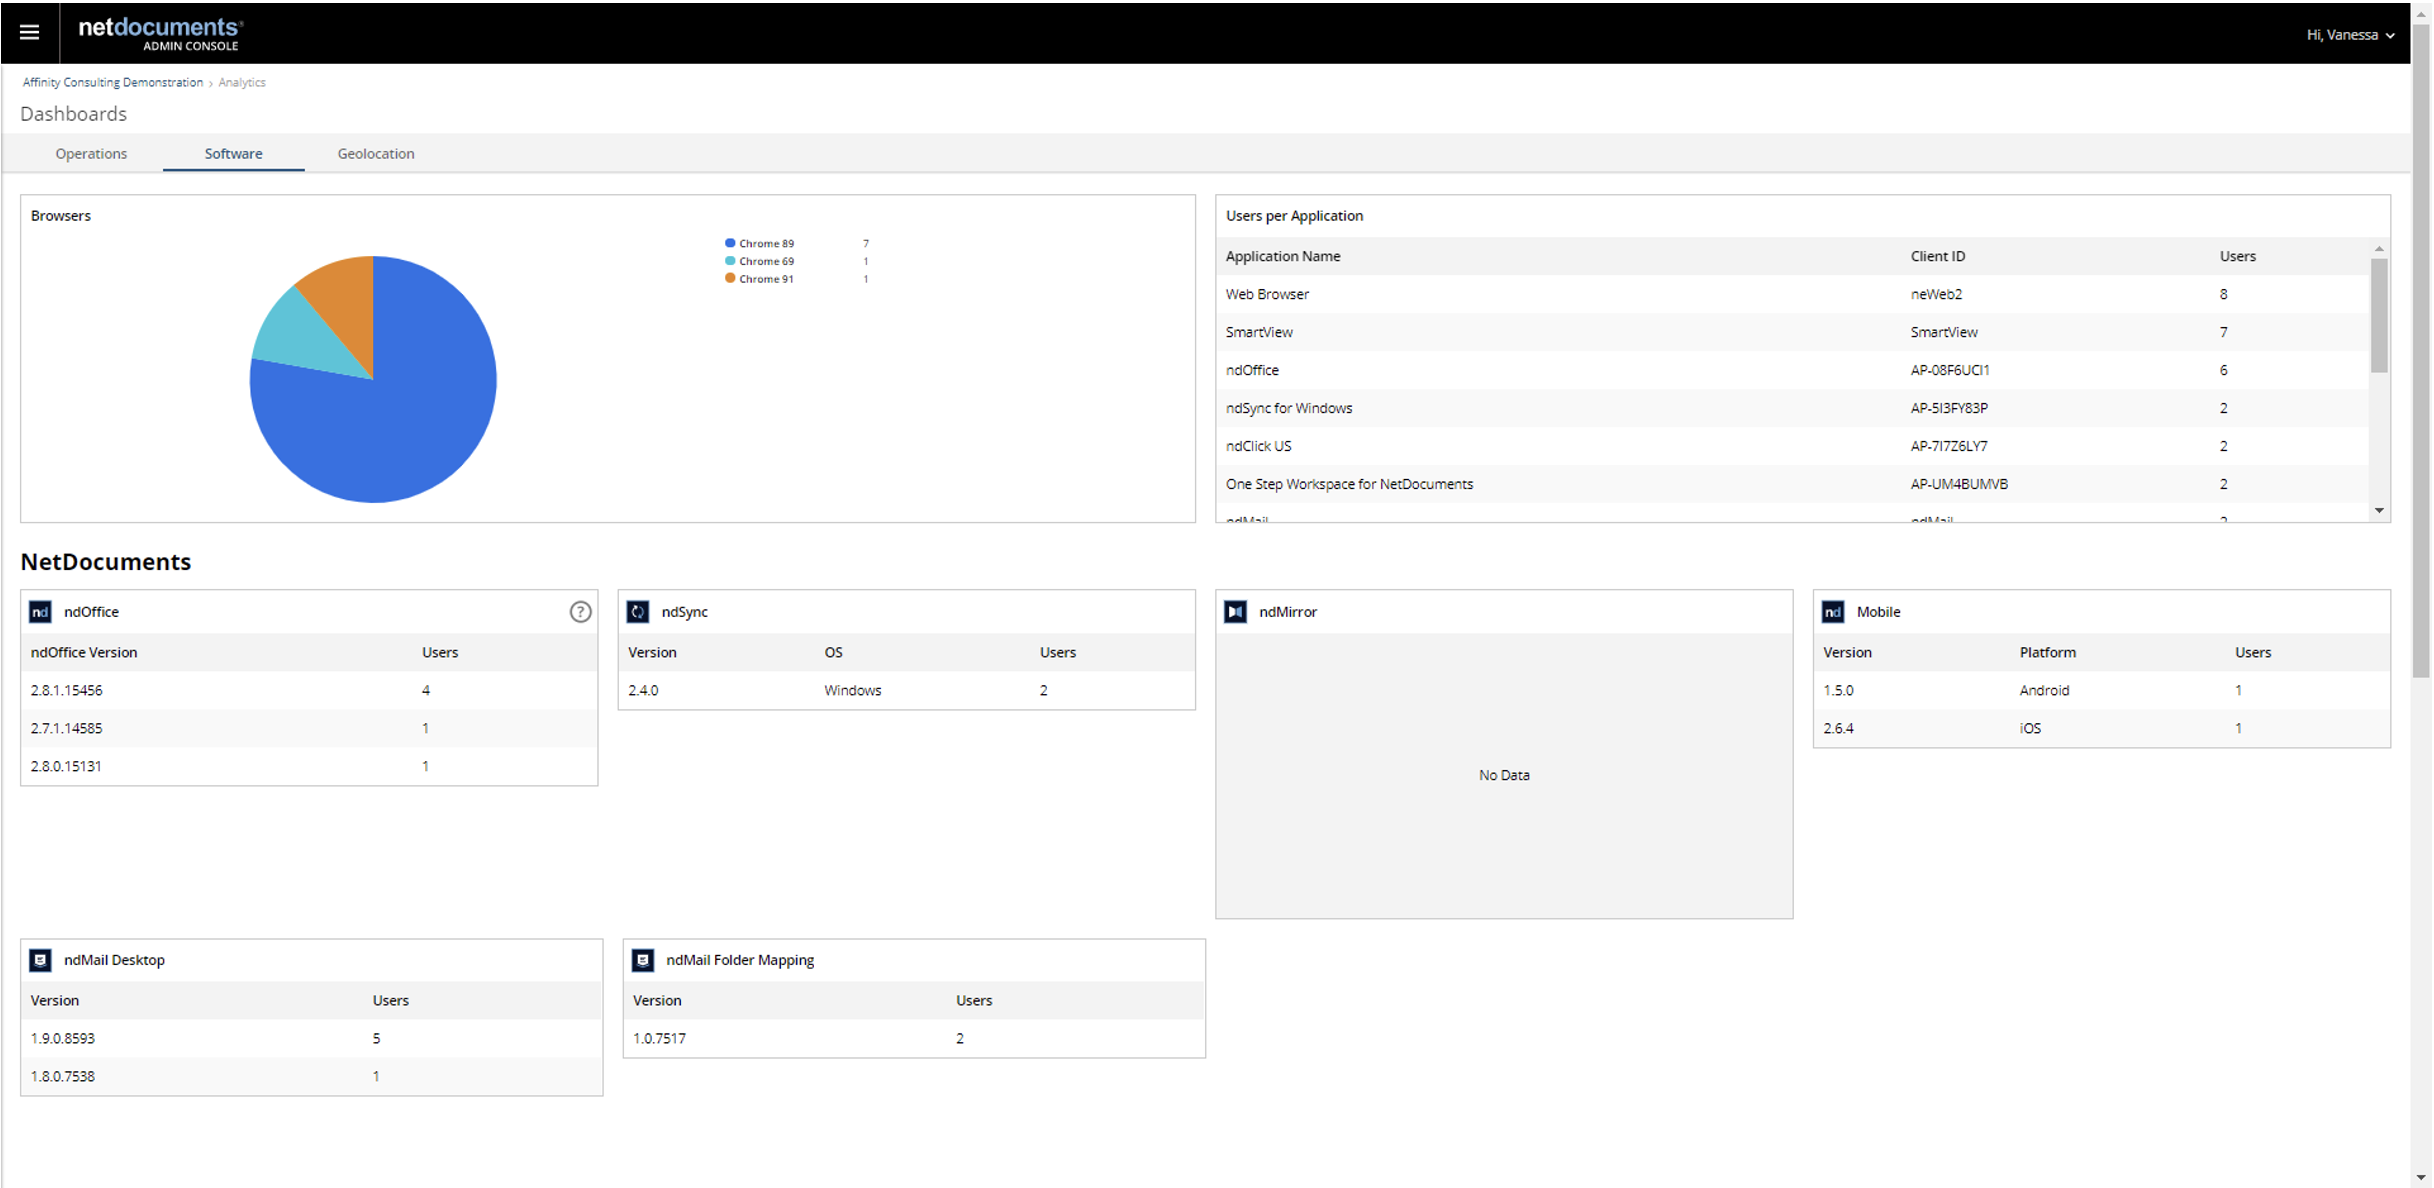
- Where users are located
- Response times on the documents
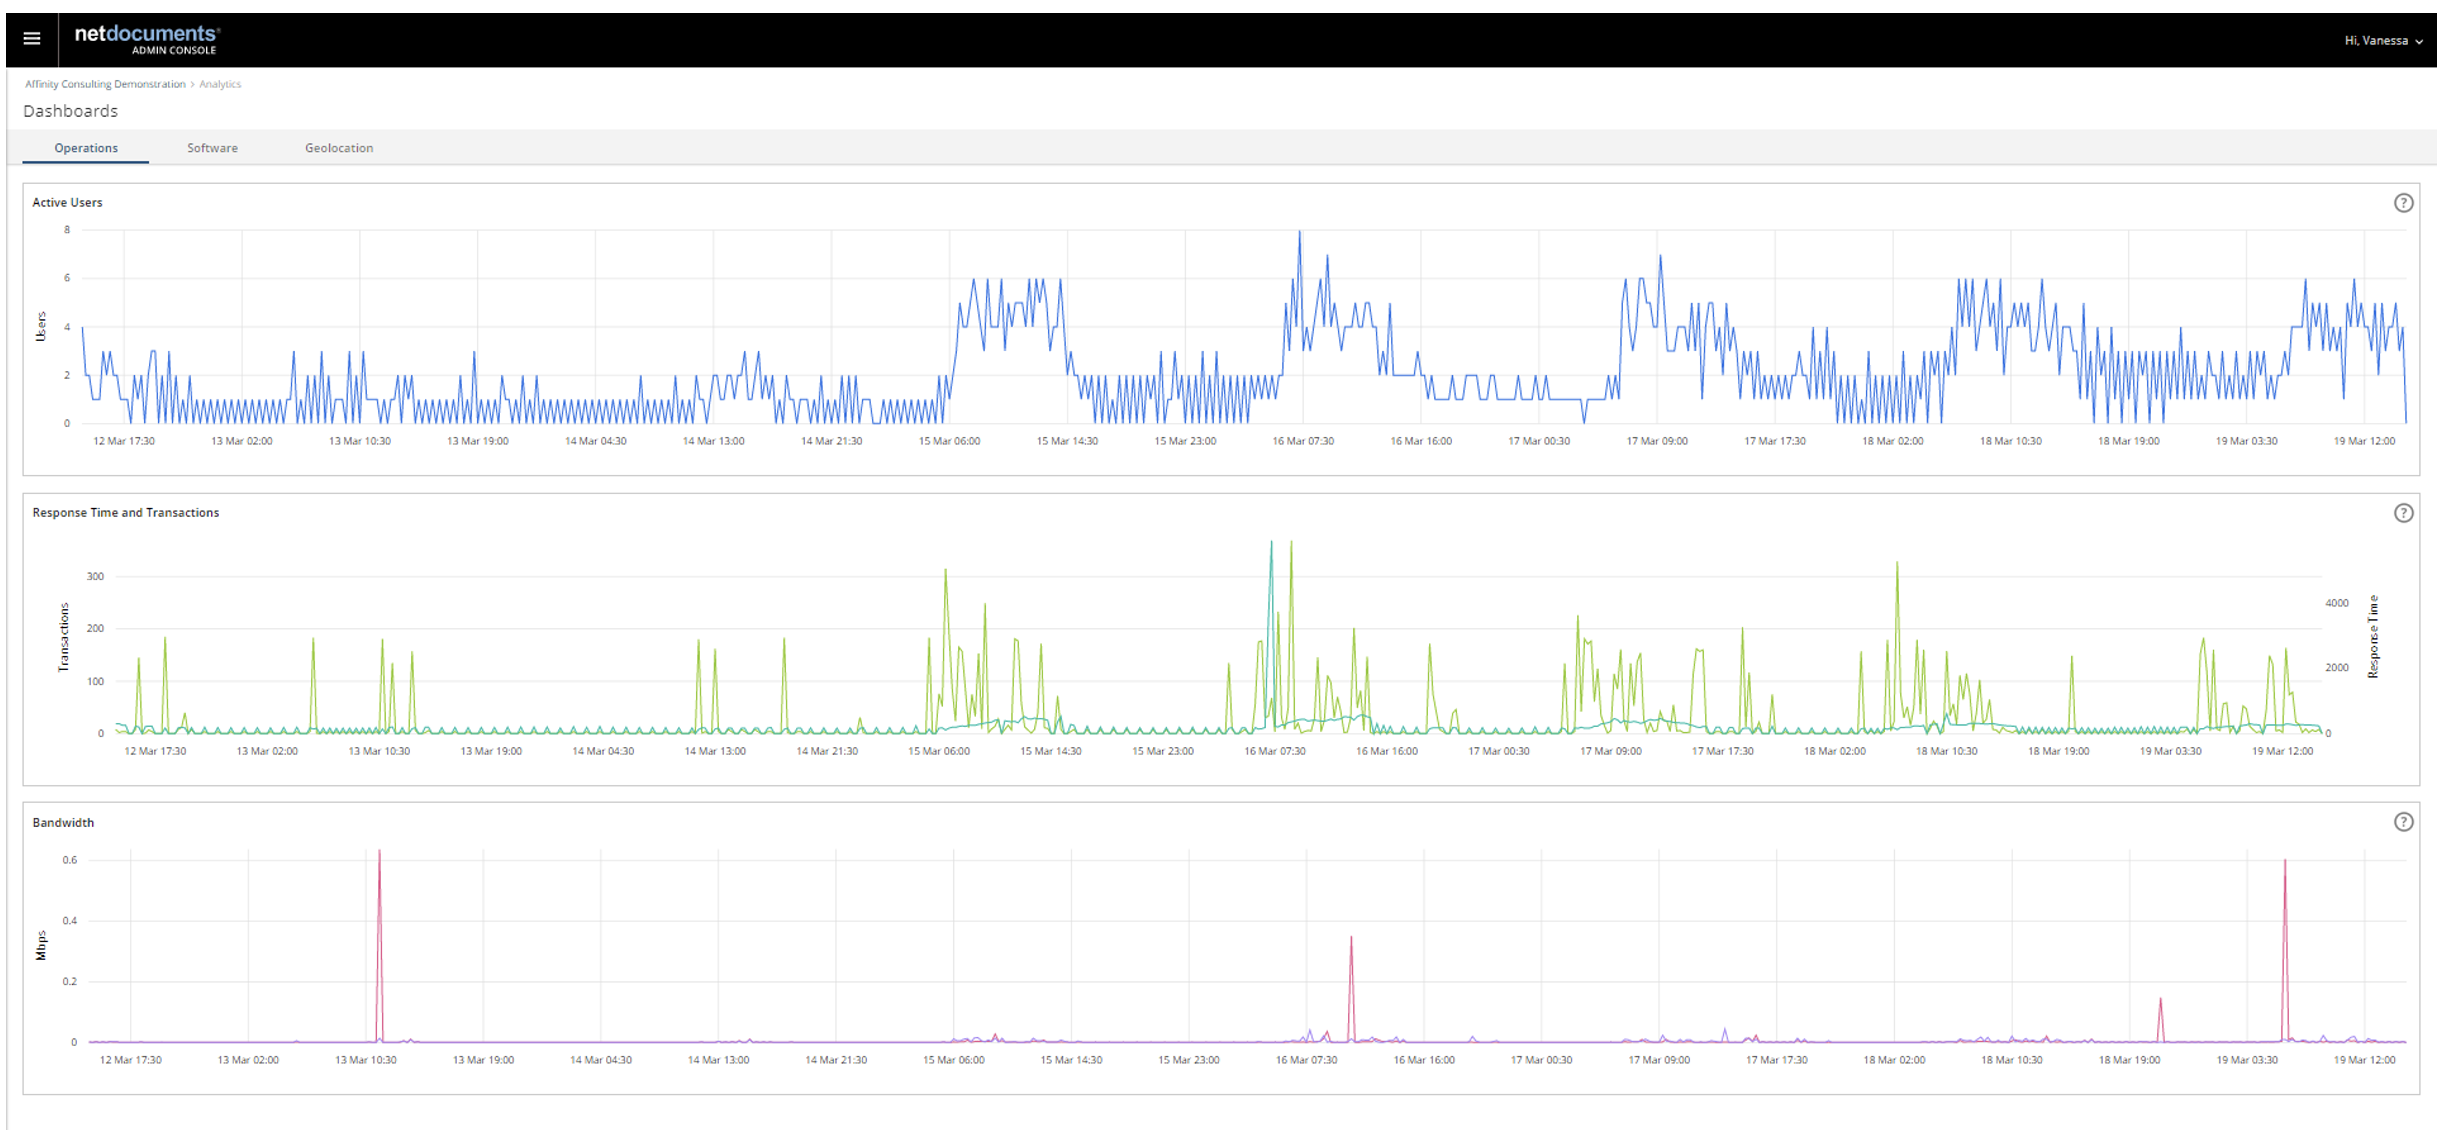
It doesn’t stop there because it also captures how many of your users are actually using NetDocuments and which components they’re using within the NetDocuments suite.
 Operations Dashboard is like Seismic charts of users, response times and the bandwidth.
 Software Dashboard shows you user adoption and uniformity of the apps across the organization.
 Geolocation Dashboard allows you to find Waldo and see his NetDocuments activities.
While the analytics of the repository is a great start, there’s more. Analytics at the Cabinet-level is a little duckling that is waiting to grow into a graceful Balinese duck! A once-over allows you to see the hard facts of that cabinet like the number of workspaces, number of documents, the breakdown of document types, and how many portals you have open via CollabSpaces.
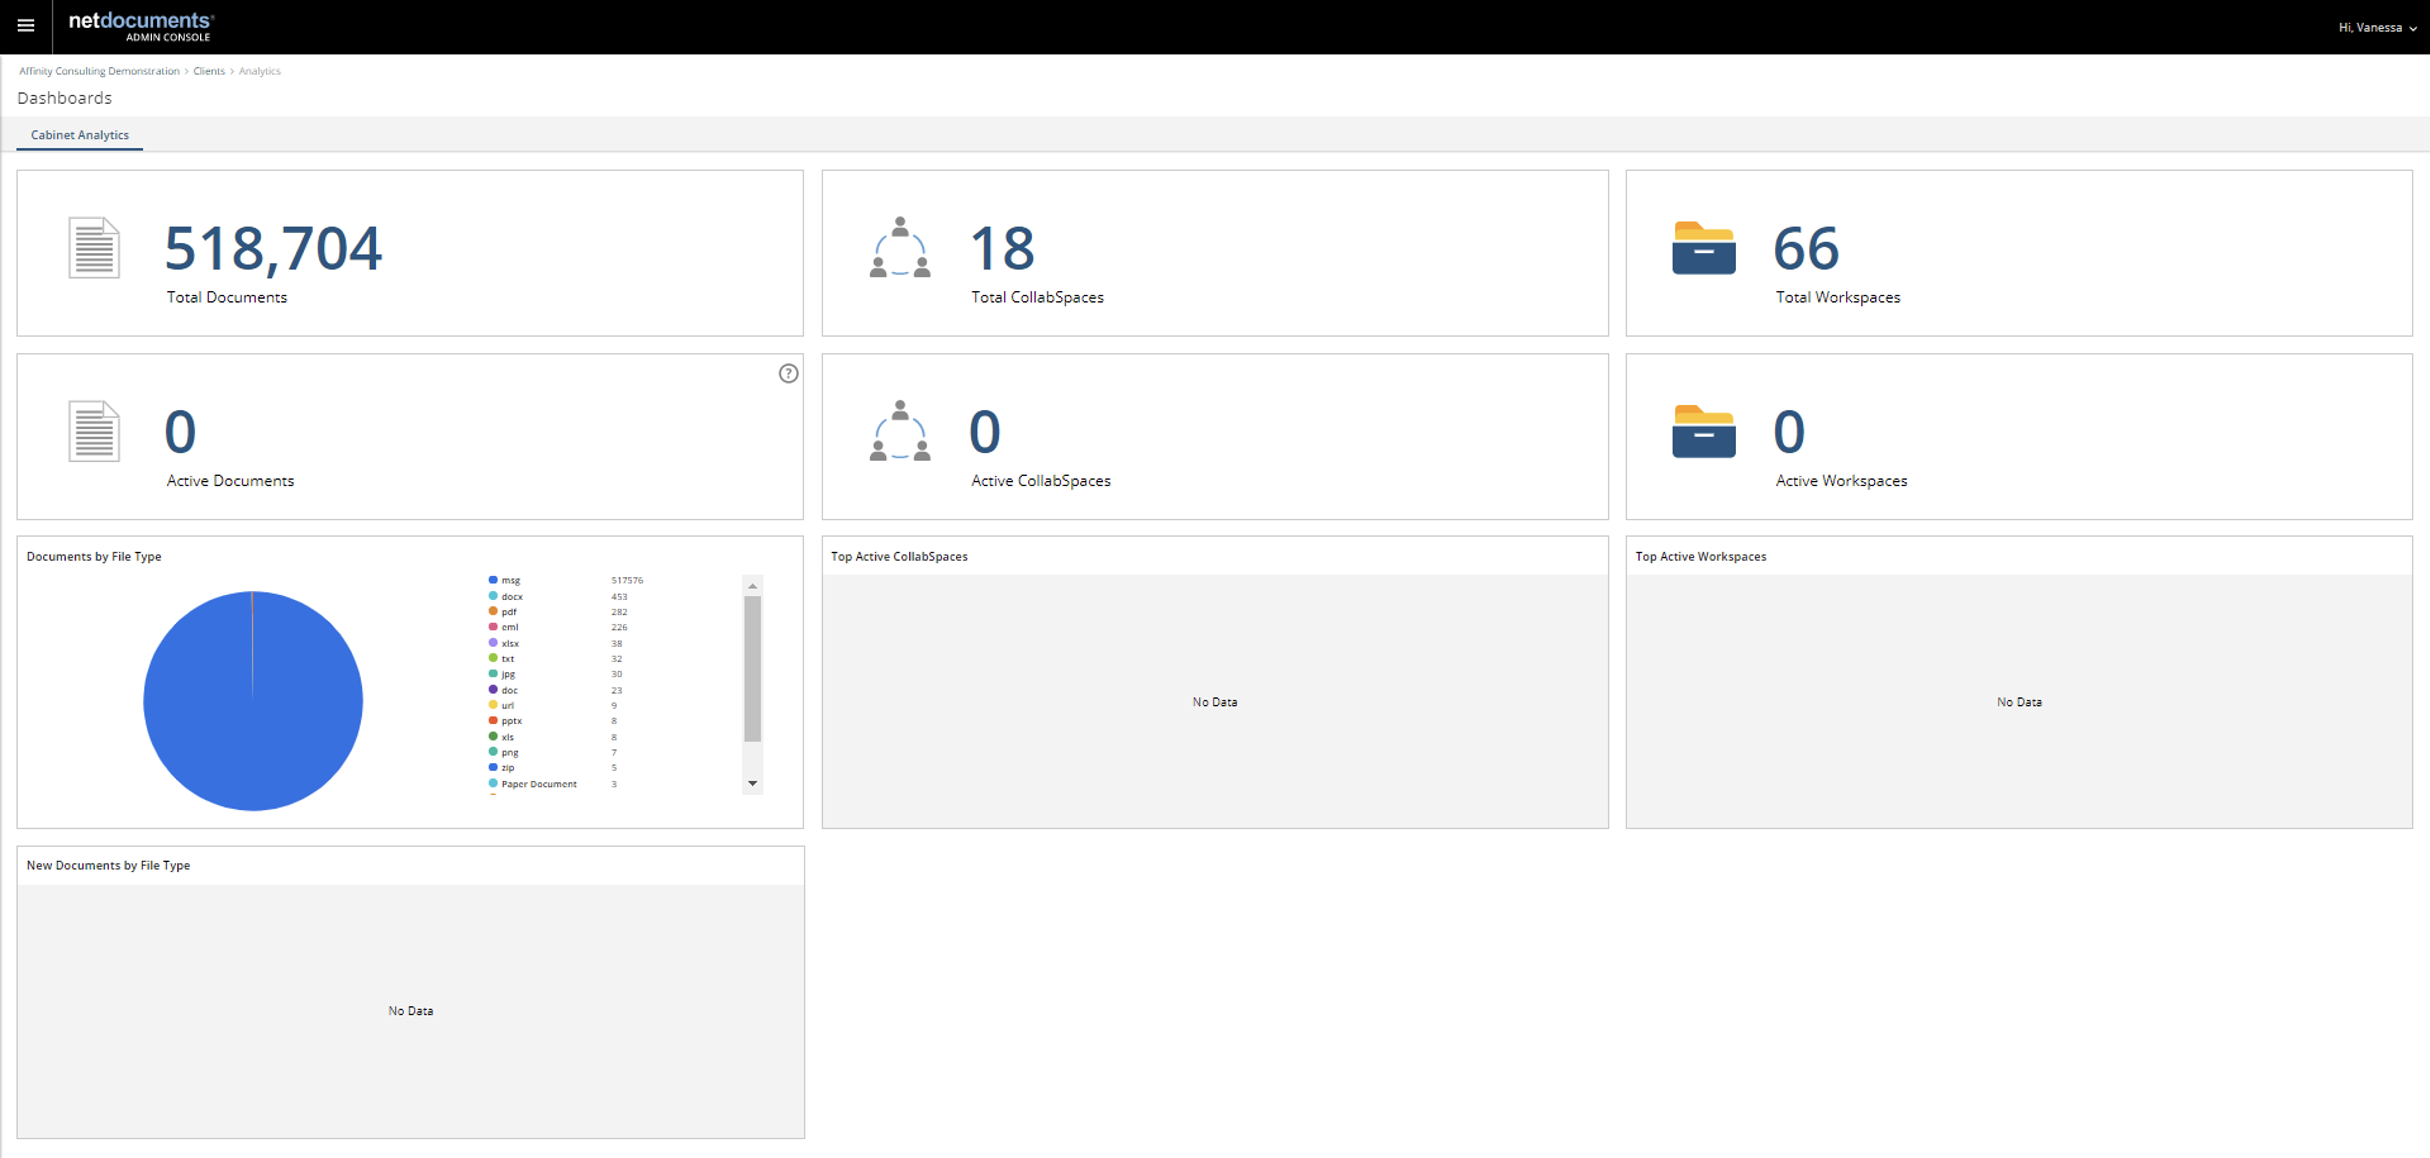 Cabinet Analytics Dashboard gives you a snapshot overview of your cabinet without having to run so many manual reports
As a first launch, you can see how NetDocuments has enhanced their software to help administrators in organizations get more time back in their day. We can’t wait to see what Analytics has in store for the Workspaces! If you’d like more information about Analytics in NetDocuments, or want to see it in action, contact the Document Management Team at Affinity by calling 877-676-5492, or simply request a consultation.